Table of contents
No headings in the article.
In the world of containerized applications, having efficient and effective monitoring tools for maintaining optimal performance and identifying potential issues at your disposal is crucial. Docker itself provides several built-in commands that offer insights into container activities. Additionally, various open source tools can significantly enhance your Docker monitoring experience, providing real-time metrics, detailed event tracking, and advanced visualization capabilities. In this article, we'll explore both native Docker commands and some noteworthy open source tools that can streamline container monitoring.
Native Docker Commands for Monitoring: Docker includes its own set of monitoring tools that allow users to gather valuable information about running containers. For instance,
the command...... "docker top container <id>", " docker stats" ........ provides current statistics for all active containers, while
'docker events --since 1h15m --filter container=<id>' offers insights into container activities over the last hour.
Enhanced Monitoring with Open Source Tools: To take container monitoring to the next level, consider utilizing the following open source tools:
- ctop: Developed in Golang, ctop is a real-time metric tool tailored for Docker container monitoring. with a simple docker command, you can quickly deploy ctop and start observing key performance indicators of your containers in a live dashboard. The command to run ctop is as follows:
docker run --rm -ti --name=ctop --volume /var/run/docker.sock:/var/run/docker.sock:ro quay.io/vektorlab/ctop:latest
- Lazy Docker: Terminal for Docker and Docker Compose Written in GoLang, Lazy Docker is a user-friendly terminal-based interface for managing Docker and Docker Compose. Its cross-platform compatibility allows installation on both Windows OS and macOS. Lazy Docker provides an intuitive way to monitor containers on the interface. To get started with Lazy Docker, use this command
docker run --rm -it -v /var/run/docker.sock:/var/run/docker.sock -v C:\Users\USER\Desktop\docker\monitoring\mount:/.config/jesseduffield/lazydocker lazyteam/lazydocker

cAdvisor: cAdvisor is a comprehensive container monitoring tool that efficiently collects metrics and logs. While lacking advanced visualization features, cAdvisor efficiently collects metrics and logs from containers. It can seamlessly send this data to various data storage and analysis tools such as Prometheus, StatsD, Elasticsearch, Kafka, InfluxDB, and fluentD.

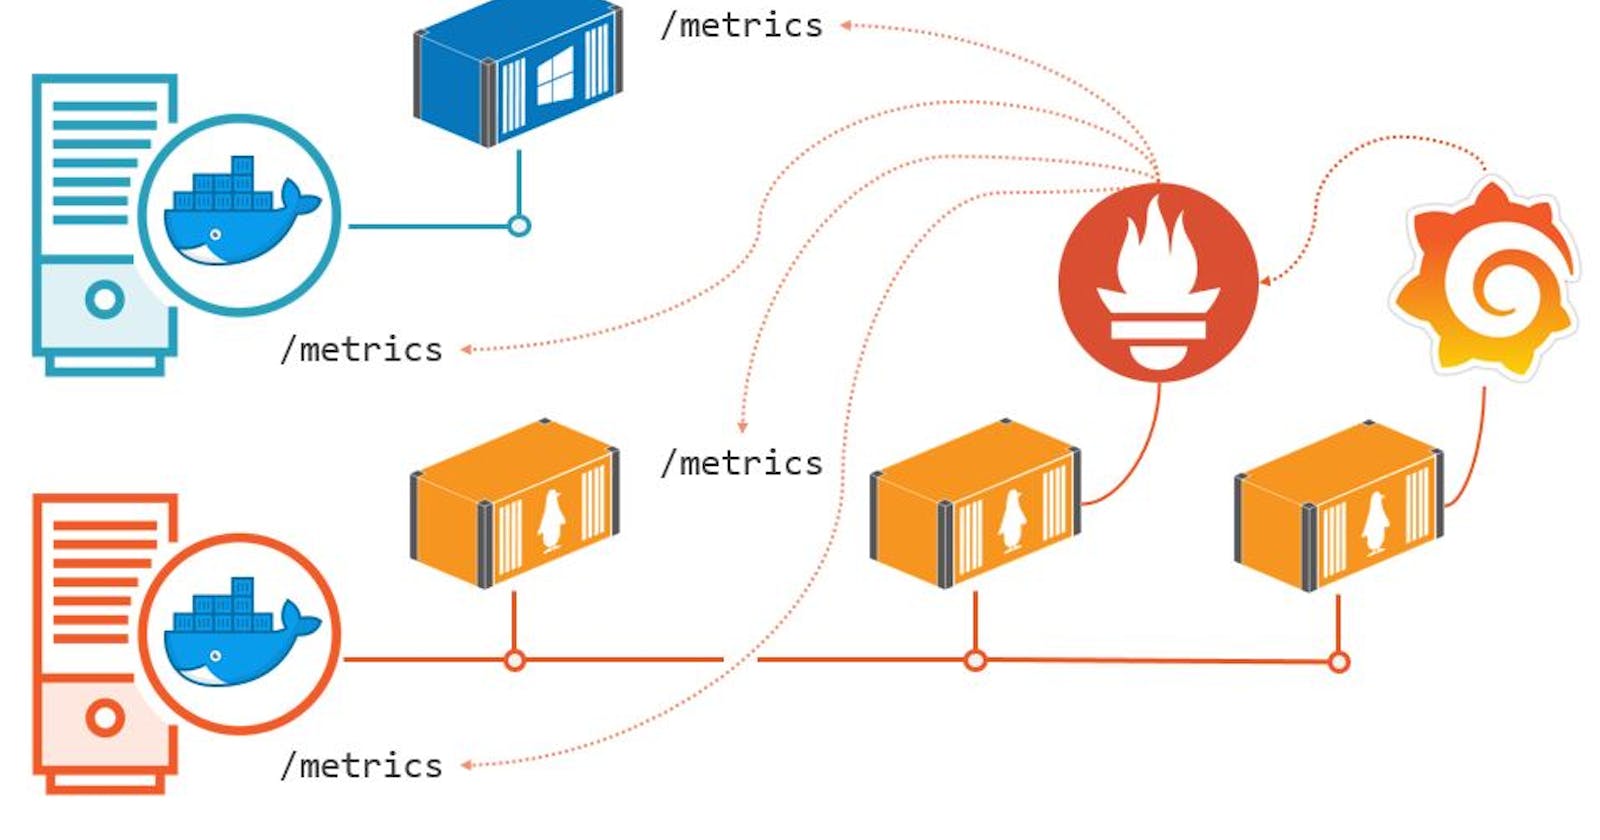
Prometheus: Prometheus stands out as a powerful data collection and time-series storage tool. It excels in data gathering and scraping, utilizing promQL to facilitate data querying

.
Node Exporter: Node Exporter provides endpoint metrics for containers, enhancing monitoring capabilities at this critical juncture.

Grafana: Grafana is a versatile tool capable of collecting data from diverse sources, including Elastic search, DynamoDB, and AWS. Its user-friendly allows you to create beautiful and interactive dashboards. it simplifies data querying and visualization, thereby enabling streamlined evaluation of logs, data, and metrics within Docker containers.

By leveraging these open source tools, monitoring Docker containers becomes not only more efficient but also more insightful, offering a deeper understanding of container performance and activities.
#ContainerMonitoring #OpenSourceTools #Docker #Prometheus #Grafana #ctop #cAdvisor #LazyDocker #NodeExporter #GoLang
